
Egypt’s Chemical and Fertilizer Exports Surge 25% to Exceed $7 Billion in Jan-Jul 2026
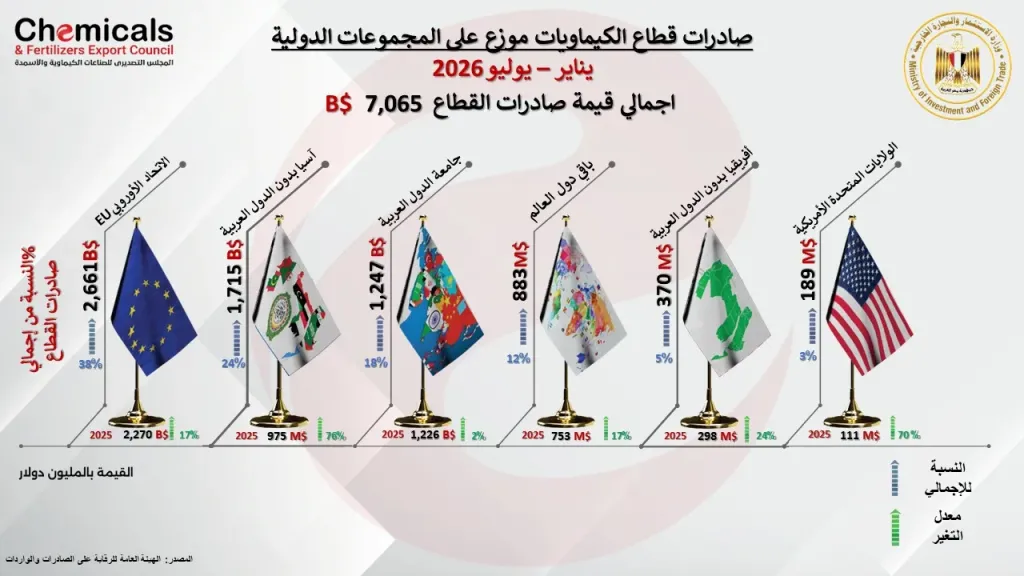
Egypt’s Chemical and Fertilizers Export Council reported a substantial 25% growth in sector exports, reaching $7.065 billion during the first seven months of 2026, up from $5.633 billion in the same period of 2025. The data, sourced from the General Organization for Export and Import Control (GOEIC), cements the sector's position at the forefront of Egypt’s non-petroleum exports, capturing a 23.5% share of the national total.
Khaled Abu Al-Makarim, Chairman of the Council, attributed this robust performance to the resilience of Egyptian manufacturers and their expanding global footprint despite global economic shifts. The growth was heavily driven by the petrochemicals sub-sector, which skyrocketed by 85% to reach $1.775 billion. Significant gains were also recorded in organic chemicals (+44%), inorganic chemicals (+30%), and detergents (+29%).
Geographically, the European Union remained the top destination, importing $2.661 billion worth of Egyptian chemicals (a 17% increase). Mohamed Magid, the Council's Executive Director, highlighted even sharper growth trajectories in non-Arab Asian markets, which surged 76% to $1.715 billion, and the United States, which saw a nearly 70% increase.
To sustain this momentum, the Council is rolling out a comprehensive international outreach plan, including a trade mission to France in February 2027, hosting international buyers at Afroplast and Agri Expo 2027, and driving aggressive participation in Q4 2026 global exhibitions across Turkey, Greece, Saudi Arabia, Morocco, China, and the UAE.
Export Performance & Growth Snapshot (Jan-Jul 2026)
The table below outlines the key growth metrics across manufacturing sub-sectors and strategic geographic markets:
Metric / Sub-SectorRecorded Value / GrowthMarket Context
Total Sector Exports$7.065 Billion (+25%)Captures 23.5% of Egypt's total non-oil exports
Petrochemicals$1.775 Billion (+85%)The leading sub-sector driving overall volume
Organic Chemicals+44%Strong manufacturing output and global demand
Inorganic Chemicals+30%Sustained capacity expansion
EU Market (Top Destination)$2.661 Billion (+17%)Remains the largest unified import bloc
Non-Arab Asia Market$1.715 Billion (+76%)The fastest-growing regional market
US Market+70%Significant acceleration in market penetration
Key Strategic Drivers & Future Outlook
Sub-Sector Diversification: The exponential 85% growth in petrochemicals, alongside steady double-digit increases in fertilizers, plastics, and detergents, reflects a highly diversified production base capable of absorbing global supply chain shifts.
Geographic Market Penetration: While the EU remains the cornerstone export destination, the aggressive penetration into non-Arab Asia, the UK, and the US highlights successful geographic diversification, mitigating regional demand shocks.
Aggressive Exhibitions Roadmap: The Council is heavily leveraging direct B2B engagements to secure future growth, targeting major Q4 2026 trade shows including Growtech and Plast Eurasia (Turkey), Saudi Build (KSA), Canton Fair (China), and Big 5 (Dubai).