
Egypt’s Chemical and Fertilizer Exports Surge 25.2% to Exceed $6 Billion in H1 2026
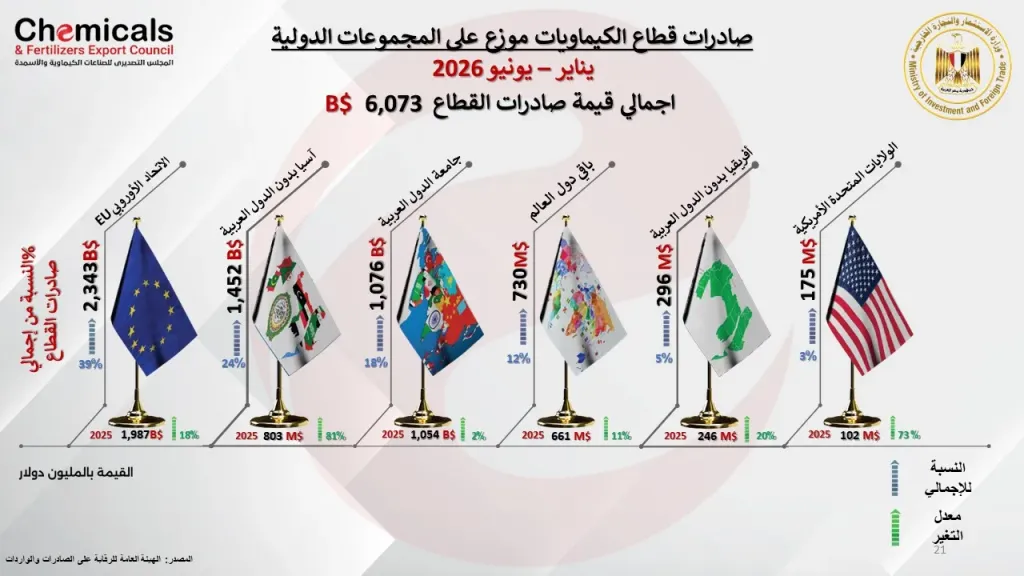
Egypt’s chemical and fertilizer sector continued its robust trajectory in global markets during the first half of 2026, recording export revenues of $6.1 billion from January to June. This marks a solid 25.2% growth compared to the $4.85 billion achieved during the same period in 2025, reflecting an absolute increase of approximately $1.22 billion.
With these results, the chemical and fertilizer sector has firmly maintained its position as Egypt's largest non-petroleum export segment, accounting for 23.2% of the country's total non-oil exports during the first half of the year.
The data underscores the sector's pivotal role in driving Egypt's export growth and enhancing product competitiveness globally. This performance was largely fueled by a diversified product base, geographic market expansion, and remarkable growth in high-value sub-sectors.
Sub-Sector Performance Breakdown
Petrochemicals led the growth among sub-sectors, posting a record leap in export value. The following table highlights the performance of the sector's key product categories during H1 2026:
Sub-SectorH1 2026 Export ValueYear-on-Year (YoY) Growth
Fertilizers$1.71 Billion+10.0%
Petrochemicals$1.46 Billion+77.9% (Up from $820.3M)
Plastics & Polymers$1.29 Billion+13.0%
Inorganic Chemicals$476.6 Million+34.0%
Detergents$232.0 Million+26.0%
Organic Chemicals$168.1 Million+27.0%
Rubber Products$102.0 Million+28.0%
Note: Other notable growth areas included Miscellaneous Products (+58%), Dry Cells & Batteries (+20%), Inks & Paints (+12%), and Glass Products (+3%).
Geographic Market Expansion
On a regional level, the European Union (EU) remained the top destination for Egyptian chemical exports. However, non-Arab Asian markets recorded the most significant leap, capturing a substantial share of total exports.
Regional MarketH1 2026 Export ValueYoY GrowthShare of Total Exports
European Union (EU)$2.34 Billion+18.0%39%
Non-Arab Asia$1.45 Billion+81.0%24%
Arab Countries$1.08 Billion+2.2%~17%
Exports to non-Arab African nations also rose by 20%, while shipments to the United States spiked by 73%.
Top 5 Strategic Export Destinations
Italy topped the list of individual importing nations, though Asian giants like India and China emerged as the fastest-growing markets. India's imports jumped from $84.7 million to $549.5 million, while China's surged from $31.4 million to $277.3 million.
RankImporting CountryH1 2026 Export Value
1Italy$649.1 Million
2India$549.5 Million
3Turkey$538.0 Million
4Spain$360.5 Million
5Brazil$330.4 Million
Exceptional YoY growth was also recorded in the United Kingdom (+172%), Saudi Arabia (+102%), Greece (+82%), and France (+17%).
Executive Insights and Future Outlook
Khaled Abu Al-Makarim, Chairman of the Chemical and Fertilizers Export Council, stated that surpassing the $6 billion mark in six months is a strong indicator of the industry's resilience and global competitiveness amidst rapid geopolitical shifts.
"The upcoming phase requires an intensified focus on increasing the value-add of Egyptian products, diversifying export destinations, and unlocking emerging markets with high growth potential," Abu Al-Makarim noted. He added that the Council will intensify trade missions, B2B meetings, and international exhibition participation to convert these opportunities into tangible contracts.
Mohamed Maged, the Council's Executive Director, echoed this sentiment, attributing the success to a coordinated board strategy aimed at market diversification. He emphasized that sustainable export growth relies not just on volume, but on building long-term global presence, elevating product quality, and swiftly adapting to international trade dynamics.
The Export Council affirmed that capitalizing on this momentum during the second half of 2026 is critical to cementing Egypt’s status as a premier regional hub for chemical and fertilizer production.